Don't Chase the Shiny (Overseas) Object
Using actual export data - vs. hype - to guide your strategic thinking
We’ve all seen the headlines in the business news talking about the opportunities and growth around international markets, particularly in developing countries. Headlines like “India’s Consumer Spending Set to Boom!” and “BRICS to Play a Leading Role in Driving Future Global Economic Growth!” have been front and center in business reporting over the past decade or so, and the focus doesn’t seem to be letting up. As I write this, a headline from Forbes today read “India's App Economy: The Opportunity is Huge. The Time is Now.”
These reports are naturally popular as they speak to our inherent drive to find the pot of gold at the end of the rainbow, but what does the data really tell us about the current state and trend-line for various export markets? In this INSIGHT, we cut and dice actual merchandise export data to see if the reality matches the hype, and what the implication might be for your business.
1. Market Size
The most basic indicator we can look at when assessing markets abroad, is, simply, market size. i.e., in dollar terms, how much as a nation are we actually exporting to various countries around the world? Given the sensationalist nature of business news, the actual data may not match your pre-conceived assumptions on export concentration… it didn’t for me.
Chart: Top 20 counties for US Merchandise Exports, 2017 ($Bs and % of total)
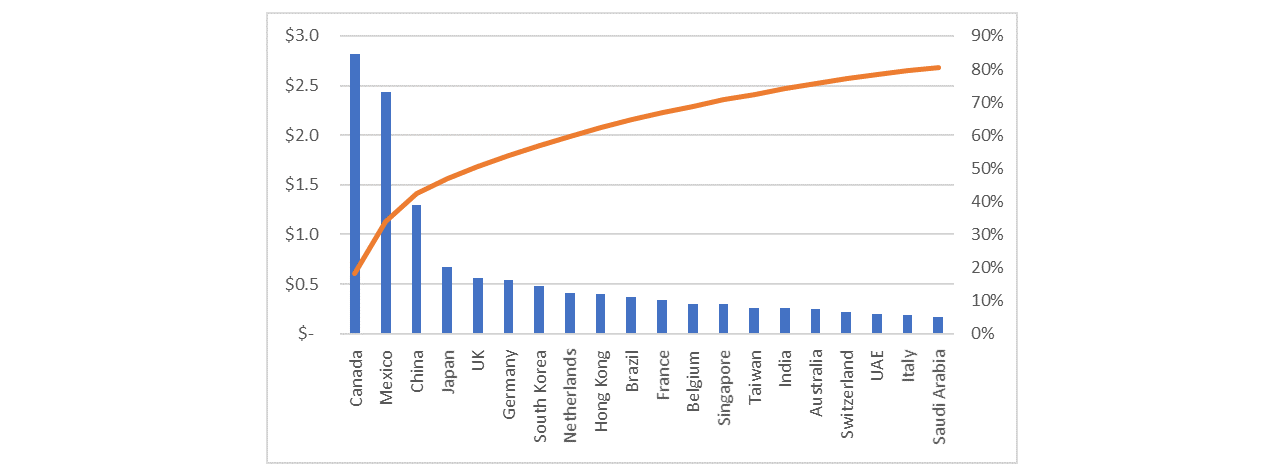
Key Observations:
1. Very high levels of export concentration:
- In the aggregate, US companies exported goods to 235 countries in 2017, ranging from $282.3B (Canada) to $1.4M (Pitcairn Islands). Despite the breadth of US exports, actual $ value is concentrated in a relatively few number of countries.
- Canada and Mexico alone represent over 1/3 of all US exports. This is not surprising given NAFTA, proximity, history, etc., but still a huge number in my view nonetheless.
- Adding in China and Japan, export concentration jumps to 50% among the top 4 countries (out of 235 total!).
- The top 20 countries shown -- less than 10% of the total number of countries globally -- account for over 80% of all merchandise exports, making the 80/20 rule look conservative.
- 20% of export markets (46 countries) represent ~95% of total exports. Put differently, the bottom 80% of countries account for only 5% of total exports.
2. Developing Markets:
Despite all the hype around growing consumer classes in India, it ranked 15th last year in US merchandise exports, behind Belgium, Taiwan, and Singapore.The BRICI countries represent a large chunk of trade ($206.7B) in the aggregate, but over two-thirds of that goes to China. Brazil, Russia, India, and Indonesia combined account for $76.8B, about 25% of Canada’s total in 2017.
Strategic considerations for your business:
- Are we overlooking key, export friendly markets (i.e., Mexico and Canada) to chase low probability opportunities in more exotic locations?
- Is there something unique about our business (product, footprint, channel, etc.) that will enable particular success in large, but ostensibly difficult to penetrate markets like India, China, and Brazil? Likewise, are we fully aware of the operational, commercial, and / or structural factors that make these markets difficult to penetrate, and do we have a plan to overcome these hurdles?
- Have our domestic competitors had any success in larger, faster-growing developing markets? If so, how can we learn from their success (and failures!)?
2. Market Growth (CAGR since 2010)
When factoring in annual growth in exports over the recent past, a more nuanced picture emerges in terms of relative market attractiveness for US exports:
Chart: Market size vs. 8 year CAGR for top 20 counties for US Merchandise Exports, 2017 (Mexico, Canada, and China excluded)
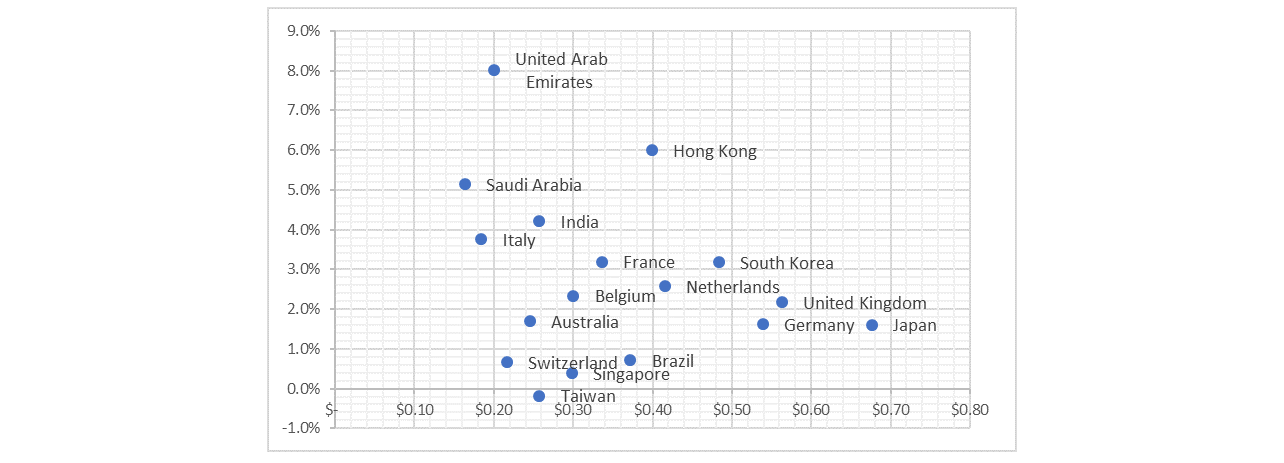
Key Observations:
- We’ve removed Mexico (5.8% CAGR), Canada (1.8% CAGR), and China (5.1% CAGR) here so as not to skew the charts, but it’s important to note that Mexico, which is our second largest export market (almost 2X the size of China) has also had the third highest growth rate since 2010, just behind Hong Kong.
- Yes, India has seen relatively strong growth in export volume, but not to the exponential rates one might assume based on media coverage. In fact, of the top 20 export markets, India at just over 4% CAGR, ranks behind UAE, Hong Kong, Saudi Arabia on this chart, as well as Mexico and China (5.8% and 5.1% respectively).
- Directionally speaking, growth rates matter. For example, assuming current growth rates, UAE will overtake Brazil in terms of market size in 8 years, and 20 years out, UAE and Hong Kong will be our 2 largest exports markets outside of China, Canada, and Mexico. We obviously can’t assume historical growth rates will remain fixed, but even what appear to be minor differences in annual growth trends may have a significant impact over the long term.
Strategic Considerations for your business:
- Have we established a foothold in smaller, “under the radar” markets that will enable us to capitalize on strong demand for US products over time?
- Are we tracking key drivers (e.g., trade deals, politics, exchange rates) that may impact strength of demand for US products going forward, and planning accordingly as it relates to our business?
3. US Exports as a % of GDP
A third cut that provides some insight into relative market attractiveness for US exporters is value per capita in key markets. The below chart is derived by simply dividing total export value by current population.
Chart: Per Capita Value of by country for top 20 counties for US Merchandise exports, 2017 ($USD)
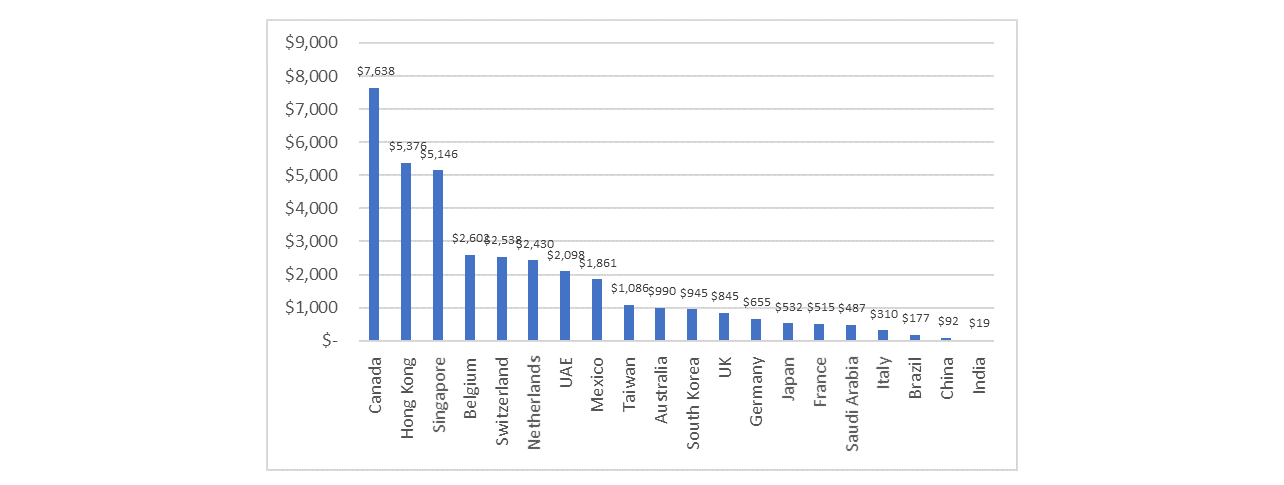
Key Observations:
Given differences in population and relative wealth, we would expect significant differences in the per capita “value” of key export destinations. That said, the gaps here are massive per capita value. A few examples:- Each “customer” in Canada is worth 400 customers in India.
- Exports to Mexico are 3X that of Japan on a per capita basis. Japan is the world’s third largest economy with GDP more than 4X that of Mexico.
- Even within certain regions, significant differences exist in relative per capita value, e.g., Belgium is over 8x Italy
- France, which is largely considered a key destination for US goods, consumes only 20% of the Netherlands, a sister EU country, on a per capita basis
- As is relates to the China vs. India debate, it’s clear from this cut at least that China represents significantly more value than India on a per capita basis. That said, both are still a fraction of many non-BRICI countries.
Strategic considerations for your business:
- Can we get enough penetration in larger, developing markets to offset potentially low value per customer relative to more popular export markets?
- Do we have a country / market specific plan for the Euro Zone or do we treat the region as a single market in terms of customer demand?
- Where can we get the biggest bang for our buck in terms of time and energy spent on customer conversion?
Conclusion
There are a bunch of reasons Canada and Mexico are far and away our largest export markets. They’re close, relatively easy to do business in, have favorable trade deals, common history, shared cultures…the list goes on. There are an equally large number of reasons why India, despite the sheer size of its population and growing middle class, still consumes a relatively small percentage of US merchandise exports: high duties, price competition, channel complexity and distance, are just a few (of hundreds in my experience!).
Macro export data, while not perfect, provides some good directional insight into how these myriad of factors translate into actual dollars spent on US goods. The data shows it’s a fairly efficient market out there. And while each business is unique, export trends can and should help guide strategic and tactical plans for expanding into international markets, including maximizing the low hanging fruit (Canada and Mexico), avoiding spinning wheels in potentially very challenging markets (India and Brazil), and focus for longer term, strategic bets going forward (UAE, Saudi Arabia).
Don't miss our next insight!
No sales here - just relevant news, ideas, tools, and resources